


150 Best
Cities for Sleep
150 Best Cities For Sleep in the United States
If you’ve ever lain awake at night wondering how — or if — your neighbors are sleeping, then read on. It turns out the same factors that influence your sleep may be affecting other residents of your town, too.
How do we know? We put together a comprehensive list of the best cities for sleep using carefully chosen metrics backed by peer-reviewed scientific studies. Sleep is affected by a range of influences, which vary from person to person. Some factors, like drinking habits, are personal or behavioral, while others, such as air pollution, affect the community as a whole. Meaning you’re probably not the only one in your area sleeping like a baby — or tossing and turning.
So, how does your city stack up? To find out, keep reading. We’ve created a comprehensive, state-by-state list of the top 150 slumber-friendly locales in the United States. Check out our top 10 cities for sleep, and don’t forget our methodology for all the details about how we selected our data.
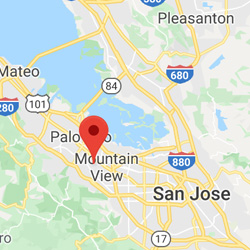
Los Altos Hills, CA
Woodside, CA
Atherton, CA
Hillsborough, CA
Cherry Hills Village, CO
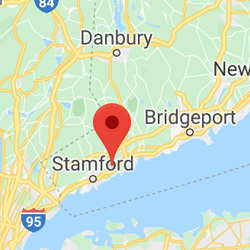
Scarsdale, NY
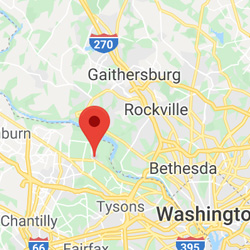
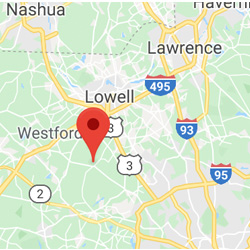
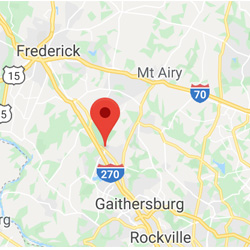
Travilah, MD
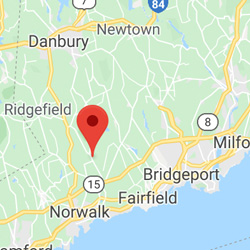
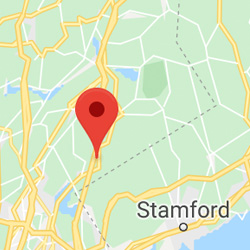
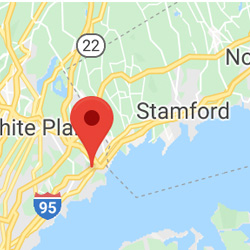
Old Greenwich, CT
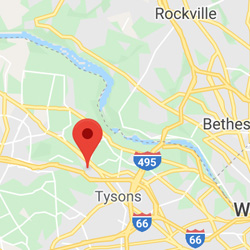
Great Falls, VA
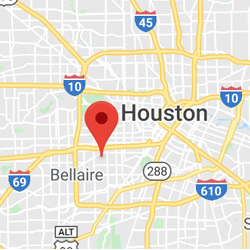
West University Place, TX
Los Altos, CA
Wolf Trap, VA
Weston, CT
Darien, CT
Greenville, NY
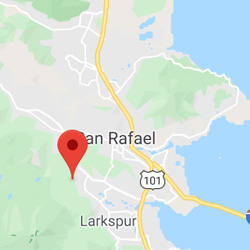
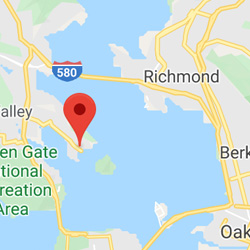
Kentfield, CA
New Castle, NY
Southlake, TX
Darnestown, MD
Piedmont, CA
Alamo, CA
Floris, VA
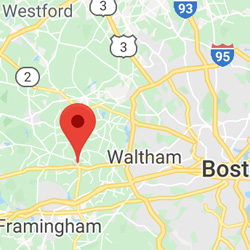
Dover, MA
Bronxville, NY
Potomac, MD
Belmont, VA
Crosspointe, VA
McLean, VA
Weston, MA
South Run, VA
Winnetka, IL
Larchmont, NY
Pound Ridge, NY
Riverside, CT
University Park, TX
Saratoga, CA
Castle Pines, CO
Loudoun Valley Estates, VA
East Hills, NY
Orinda, CA
Westport, CT
Coto De Caza, CA
Glencoe, IL
Wilton, CT
Fort Hunt, VA
Dranesville, VA
Highland Park, TX
Long Grove, IL
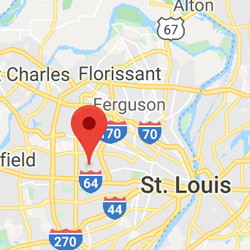
Ladue, MO

The Village Of Indian Hill, OH
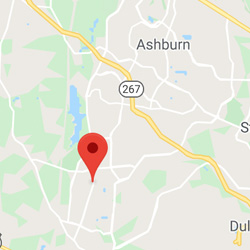
Brambleton, VA
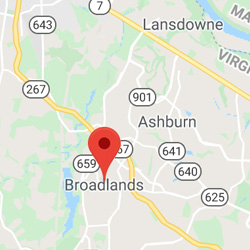
Broadlands, VA
North Castle, NY
North Potomac, MD
Tamalpais-Homestead Valley, CA
New Canaan, CT
Bellaire, TX
Wellesley, MA
East Foothills, CA
South Kensington, MD
Fairfax Station, VA
Franklin Farm, VA
Palos Verdes Estates, CA

Blackhawk, CA
Dunn Loring, VA
Sudbury, MA
Carlisle, MA
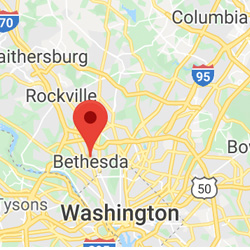
Bethesda, MD
Rye, NY
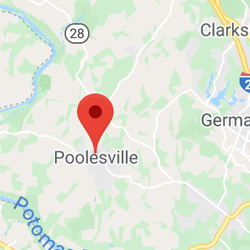
Poolesville, MD
Cupertino, CA
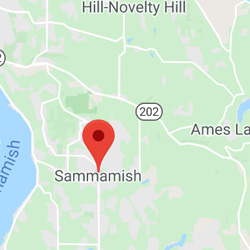
Sammamish, WA
Tiburon, CA
Wayland, MA
San Carlos, CA
Lowes Island, VA
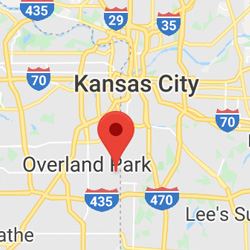
Leawood, KS
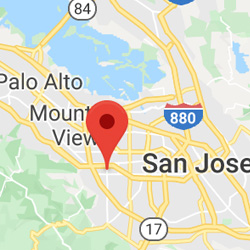
Palo Alto, CA
Duvall, WA
Mantua, VA
Fulshear, TX
Lake Forest, IL
Lexington, MA
Hawthorn Woods, IL
Ladera Ranch, CA
El Granada, CA
The Pinery, CO

Mill Valley, CA
Scaggsville, MD
Cottage Lake, WA
Paradise Valley, AZ
Cold Spring Harbor, NY

Montecito, CA
Wakefield, VA
Vienna, VA
Pelham Manor, NY
Briarcliff Manor, NY
Summit Park, UT
Minnetrista, MN

La Cañada Flintridge, CA
Upper Uwchlan, PA
Lake Bluff, IL
Ridgefield, CT
South Riding, VA
Medfield, MA
Inverness, IL
Winchester, MA
Marvin, NC
Olney, MD
New Albany, OH
Eagle, CO
Corte Madera, CA
Hopkinton, MA

Terrell Hills, TX
Woodbury, NY
Superior, CO
Lone Tree, CO
Hinsdale, IL

Villa Park, CA
Clarksburg, MD
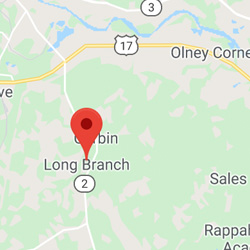
Long Branch, VA
Foster City, CA
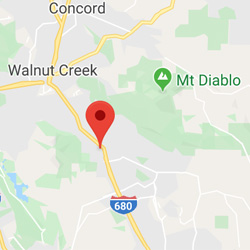
Danville, CA
Lafayette, CA
Ashton-Sandy Spring, MD
Victoria, MN
West Deerfield, IL
Los Gatos, CA
Mercer Island, WA
Snoqualmie, WA
Cascades, VA
Stonegate, CO
Menlo Park, CA
San Marino, CA
Lewisboro, NY
Garden City, NY
Highlands Ranch, CO
Stone Ridge, VA
Erie, CO
Stow, MA
Westwood, MA
Pinecrest, FL
Medina, MN
Roxborough Park, CO
Cochituate, MA
Clayton, CA
New Trier, IL
Kings Park West, VA
Manhattan Beach, CA
North Tustin, CA
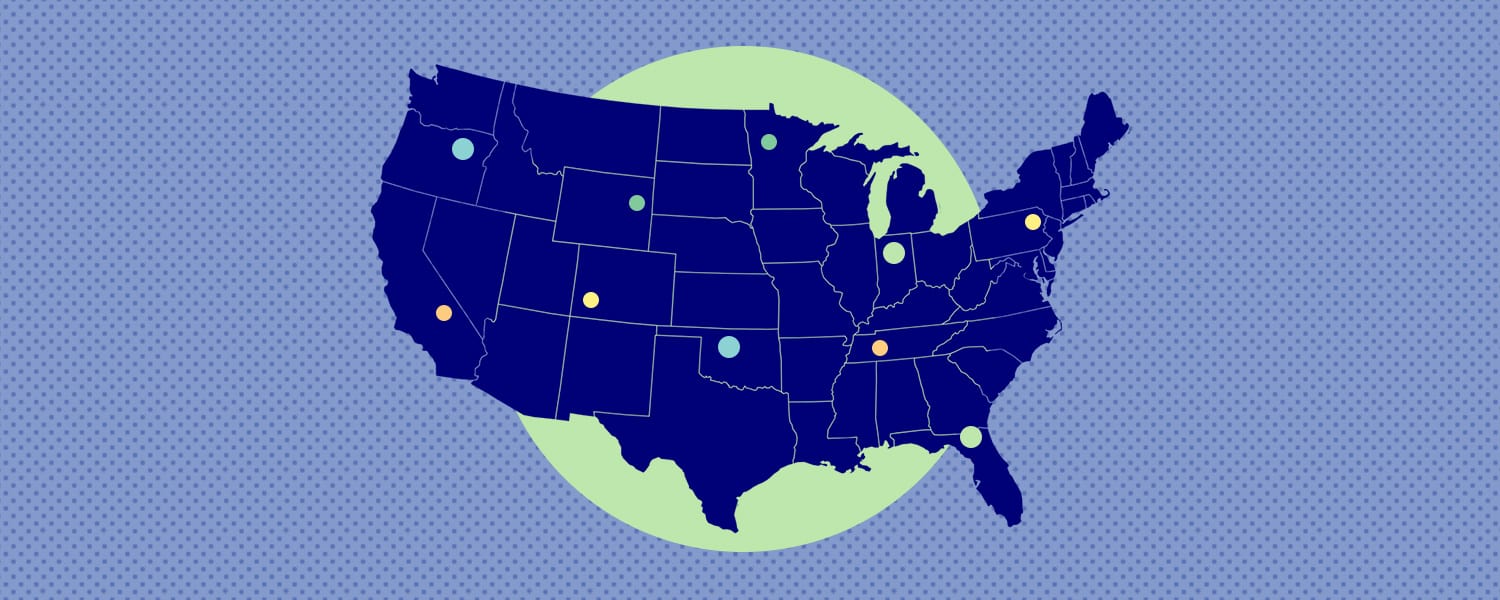
The Top 10 Cities Overview
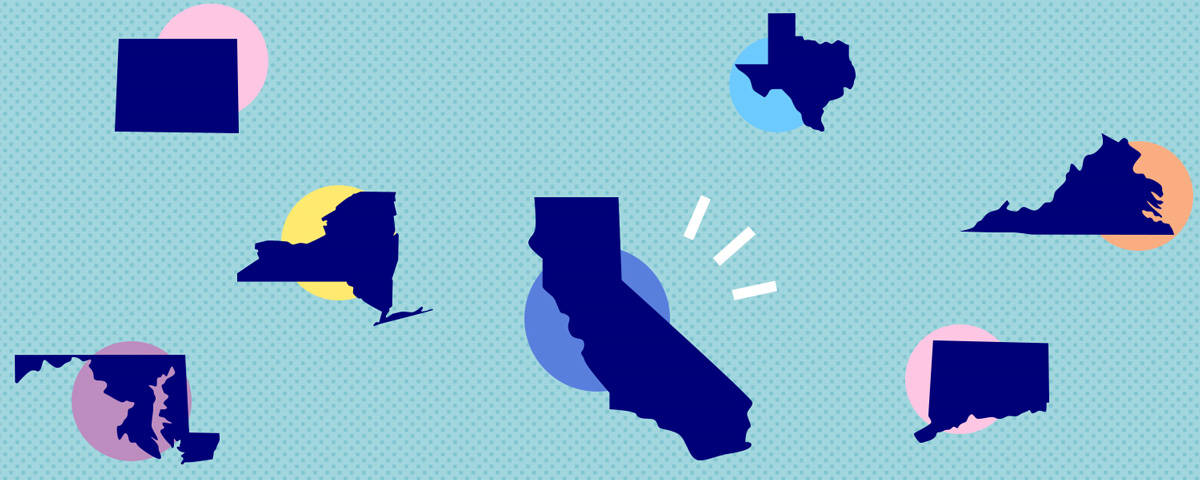
The Golden State of California nabs the top four slots, quite an honor given the number of cities we looked at. Why such a strong showing from a single state? Well, residents of these four California locales boast a healthy median income, lower rates of smoking, and low unemployment, and spend fewer nights lying awake than folks in many other metropolitan areas.
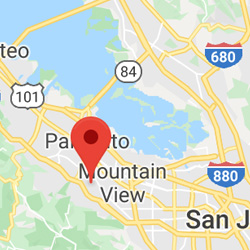
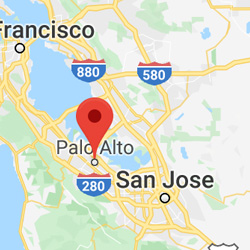
1. Los Altos Hills, California
Topping our list at number 1 is another small city in the Golden State, Los Altos Hills. This wealthy Silicon Valley town has no post office or library, a result of a ban on commercial zones. What Los Altos Hills does have is plenty of palm trees, palatial estates, and healthy sleep. Residents of this sylvan city enjoy minimal air pollution and rock-bottom rates of obesity, unemployment, and excessive drinking. You won’t find many smokers in this hilly town, where adequate sleep and mentally healthy days are par for the course. It’s nothing but clear skies for the residents of Los Altos Hills, our top choice for sleep.
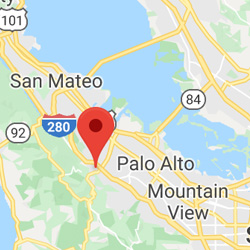
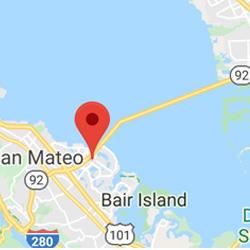
2. Atherton, CA
Coming in at number 2 is Atherton, a charming Northern California town located an hour’s drive from San Francisco. Considered one of the wealthiest communities in the US, Atherton consists of just 5 wooded square miles nestled along the Pacific coast. With their exceptional scores in every category from exercise to employment, folks in this small city know what it takes to get a good night’s sleep. Just 300 in 1000 residents report insufficient sleep every year, and only 27 in 1000 are unemployed. Just as important, they experience fewer than 3 mentally or physically unhealthy days each month. Across-the-board high marks add up to a lot of healthy sleep in Atherton, making this city a shoo-in for our number 2 slot.
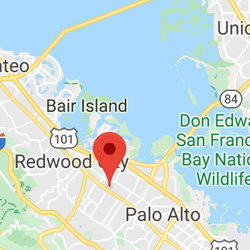
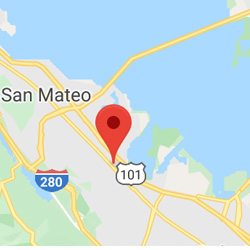
3. Woodside, CA.
Our number 3 pick — Woodside, CA, another town in sun-drenched San Mateo County. Located about 15 miles south of Hillsborough, Woodside has the smallest population — just 5500 — of any city in our top 10. But what Woodside lacks in population, it makes up for in horses. This tiny town is known for its equine-loving community and network of scenic horse trails. If Woodside sounds like the ideal place to sleep, it is. Low unemployment, food insecurity, and air pollution help residents reduce stress along with the risk of sleep apnea. Folks in Woodside smoke less and exercise more than people in many other cities in the country, boosting their overall score and landing them in our top 3.
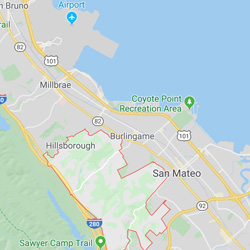
4. Hillsborough, CA
Let’s head out to California, the location of our number 4 pick for the best cities for sleep. Hillsborough is located in San Mateo County 17 miles from San Francisco and is known for its winding and hilly landscape. This sunny suburb has a Mediterranean climate and a population of around 11,500. So, what do residents’ sleep habits look like? Well, not only do folks here get top marks for physical activity and low obesity, they rack up fewer mentally unhealthy days, a good indicator of healthy slumber. As far as good shuteye goes, it doesn’t get much better than Hillsborough, where just 300 residents out of 1000 report insufficient sleep each year. Smoking and drinking rates are low, too, helping to secure Hillsborough’s impressive showing at number 4.
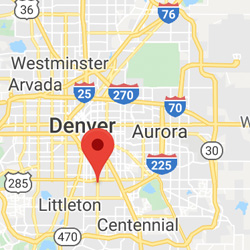
5. Cherry Hills Village, Colorado
The award for smallest population in the top 10 goes to Cherry Hills Village, Colorado, recently named 2nd richest city in the country. This town of 6600 residents is known for its palatial homes and proximity to Denver. Celebrities who have lived in Cherry Hills Village include Madeleine Albright and Peyton Manning. So what sets the city apart when it comes to sleep? Of all the locations in our top 10, Cherry Hills Village has the lowest rate of insufficient sleep. It’s also tied with 4 other top cities for the fewest number of days without physical activity. Residents of this mile-high town are a healthy bunch, racking up more physically healthy days than any of our other 10 best cities except for Travilah, Maryland. Higher rates of smoking and drinking knock Cherry Hills Village down a few notches, but if it’s sleep you’re after, this town is a great place to get it.
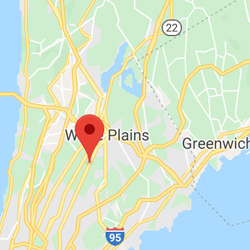
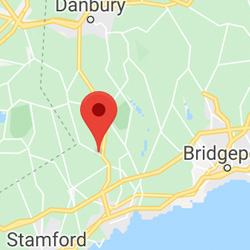
6. Scarsdale, New York
Next stop, Scarsdale, an affluent suburb of New York City. Scarsdale is tied with two of our other top 10 cities for highest median income, one of the crucial lifestyle factors that contributes to healthy sleep. With almost 18,000 residents, Scarsdale has the highest population of all the towns in our top 10 and one of the lowest rates of obesity. People who live in Scarsdale smoke less and work out more than people in many other cities, reducing their risk for breathing-related sleep disorders. What knocks Scarsdale out of the top 5? Rates of excessive drinking and unemployment chip away at its overall score, bringing this generally well-slept city to number 6.
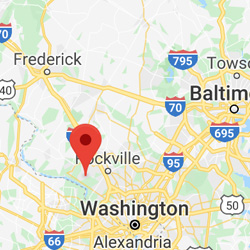
7. Travilah, Maryland
Welcome to Travilah, Maryland. This unincorporated area near the tony suburb of Potomac may not have its own zip code, but it does have some of the most rested residents in the United States. The town is home to a population of just over 12,000 as well as the Travilah Oak, a 285 year-old oak tree that stands almost 80 feet high. Travilah has the fewest number of mentally unhealthy days of any city in our top 10, and fewer physically unhealthy days than every top 10 city except Great Falls, Virginia. This high-income town also boasts low obesity, smoking, and insufficient sleep scores. So why isn’t Travilah in our top 5? Higher levels of air pollution may contribute to snoring, sleep apnea, and disrupted sleep.
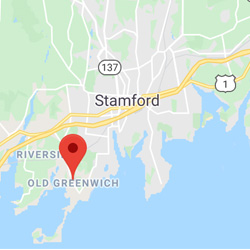
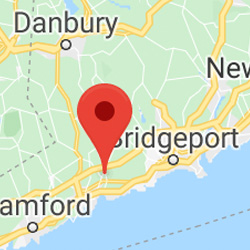
8. Old Greenwich, Connecticut
Heading north, the next city on our list is Old Greenwich, Connecticut. This coastal hamlet is located 40 miles from New York City and is one of the wealthiest towns in the country. With a population of 7500, Old Greenwich is among the smallest cities in our top ten. It’s also one of the best-slept. Residents of Old Greenwich enjoy lower rates of obesity and fewer poor physical health days than many of the towns we rated. Favorable air pollution levels help to reduce the risk of sleep apnea and asthma. Despite an impressively low insufficient sleep rating, slightly higher unemployment, smoking, and food insecurity scores keep Old Greenwich in the number 8 spot.
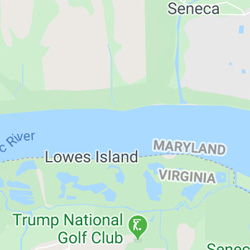
9. Great Falls, Virginia
Taking the number 9 spot is Great Falls, Virginia on the picturesque bank of the Potomac River. Because this suburban community is only 15 miles from downtown Washington, many politicians and government employees call it home. So how do the residents of this bucolic town sleep? Well, they’re ahead of all but one of our top 10 choices when it comes to air pollution. They have one of the lowest excessive drinking rates of any of the 150 cities on our list, and their exercise habits are up there with the best. So why doesn’t Great Falls rank higher? Insufficient sleep rates are higher and the number of mentally healthy days is lower than some other top cities. Given the city’s proximity to Washington DC, these indicators may be tied to long work hours or the stress of life in politics.
10. West University Place, Texas
Coming in at number 10 is the town of West University Place in the great state of Texas. Also known as West U, this leafy Houston bedroom community has a population of around 16,000 and, according to our statistics, these folks know how to sleep. West U residents enjoy a lower than average obesity rate, fewer physically and mentally unhealthy days, and lower rates of excessive drinking than much of the country. Adequate sleep is the norm in West U, though around 340 residents out of 1000 still report insufficient slumber each year. West U has slightly higher rates of unemployment, air pollution, and food insecurity than our other top picks, keeping it from rising higher on the list.
The Best Cities for Sleep by State
Alabama
Alaska
Arizona
Arkansas
California
Colorado
Connecticut
Delaware
Florida
Georgia
Idaho
Illinois
Indiana
Iowa
Kansas
Kentucky
Louisiana
Maine
Maryland
Massachusetts
Michigan
Minnesota
Mississippi
Missouri
Montana
Nebraska
Nevada
New Hampshire
New Jersey
New Mexico
New York
North Carolina
North Dakota
Ohio
Oklahoma
Oregon
Pennsylvania
Rhode Island
South Carolina
South Dakota
Tennesse
Texas
Utah
Vermont
Virginia
Washington
West Virginia
Wisconsin
Our Methodology
When compiling our list of the best cities for sleep, we started with sufficient vs. insufficient sleep and then tied in some other crucial metrics. How did we pick these metrics in particular? We looked at the latest research and found a strong connection between healthy sleep and certain behaviors and environmental factors.
Here’s the breakdown of the data we chose:
Adult obesity rates
The current obesity rate in the United States hovers around 35%. Rates of obesity tend to be more prevalent in the south but are increasing country wide. We looked at obesity rates by state to help us rank the best cities for sleep. Why obesity? A larger body mass index is strongly associated with sleep apnea, a sleep disorder characterized by pauses in breathing, daytime sleepiness, and an increased risk of diabetes and cardiovascular disease. (1)
Obesity can also contribute to insomnia and other sleep disorders such as hypersomnia (excessive sleeping) and restless legs syndrome. Weight gain and changes in fat metabolism can result from long-term sleep deprivation and sleep apnea. Obesity can also cause other sleep-related issues such as snoring and a chronic lack of oxygen called obesity hypoventilation syndrome.
Number of mentally healthy days
Depression and other psychiatric disorders can cause sleep disorders, and sleep disorders can contribute to psychiatric issues. (2) An analysis of major studies revealed that volunteers who suffered from insomnia symptoms were twice as likely to be diagnosed with depression as those without sleep difficulties. Medications to treat psychiatric disturbances can also cause insomnia.
Though the connection between mental health and sleep disorders isn’t entirely understood, it is well-known that hormones and neurotransmitters are affected by poor sleep and may have a strong influence on mood and the development of psychiatric conditions. Because of the significant impact of mental health on sleep disorders, we gave the number of mentally healthy days significant weight when compiling our list of the best cities for sleep.
Excessive drinking
We included excessive alcohol consumption on our list due to its effect on REM sleep and overall sleep quality. Rates of drinking are increasing in the United States, particularly among women, older people, and lower income groups. Binge drinking rose nearly 30% between 2002 and 2013, while alcohol abuse surged 50%.
Studies prove that alcohol can reduce sleep efficiency and change sleep patterns. (3) Although alcohol can reduce the time it takes to fall asleep, it can cause waking during the night once its effects on the central nervous system wear off. For these reasons, we included the drinking habits of a city’s residents in our data when selecting the best cities for sleep.
Physical inactivity
Because physical activity can impact sleep and the circadian rhythm, we included exercise — or the lack of it — when making our list of slumber-friendly cities. Studies show that exercise has a positive effect on sleep, particularly in people with chronic insomnia. (4) Exercise impacts the effect of stress hormones like cortisol and adrenaline, which can contribute to hyperactivation of the central nervous system, a common cause of insomnia.
Sufficient sleep is also necessary for the proper functioning of muscles and the repair and rebuilding of tissues after a workout. The majority of muscle regeneration takes place during sleep when growth hormone is released by the pituitary gland. It’s no coincidence that cities with a higher percentage of regular exercisers tend to rank higher on our list of best cities for sleep.
Smoking
Smoking or consuming nicotine in any form is a hazard to sleep health. Nicotine is a powerful stimulant that can prevent or delay sleep. (5) Withdrawal from nicotine is a common cause of insomnia, as well. Because of its effect on the lungs and blood vessels, nicotine can increase breathing disorders that impact sleep, such as asthma and sleep apnea. Although vaping does not involve the inhalation of smoke, it can deliver more powerful stimulant effects than smoked nicotine, disrupting sleep even further.
Studies show that people who consume nicotine in any form spend less time in deep sleep, particularly during the early part of the night when blood levels of nicotine are highest. Sleep can also be disrupted as nicotine levels drop toward morning and cravings increase. The data is so convincing that we included nicotine use on our list of behaviors that influence sleep.
Air pollution
Air pollution was a key factor in our rankings of the best cities for sleep. Metrics included particulate pollution from cars and ozone levels. Higher levels of air pollution are linked to increased rates of asthma, cardiovascular disease, chronic obstructive pulmonary disease, and lung cancer. (6) There is a strong connection between asthma and obstructive sleep apnea, which can cause weight gain, heart problems, increased risk of stroke, and diabetes.
Air pollution can also cause upper airway congestion, leading to snoring and raising the risk of sleep apnea. Cities with higher levels of pollutants experience more days of unhealthy air quality, making physical exercise and outdoor activities more harmful to the lungs. Air pollution is often caused by urban conditions including traffic and construction, which can create a noisy environment that further disrupts sleep.
Food insecurity
We added food insecurity to our list of important sleep metrics because of its influence on physical and mental health. (7) Food insecurity describes a lack of available food, lack of access to food, and/or a lack of food that contains adequate nutrition. A recent study showed that people who sleep less than seven hours a night tend to consume fewer vitamins and minerals such as A, D, and magnesium.
The US government measures food insecurity by asking questions on the Census Bureau’s Current Population Survey. Not surprisingly, food insecurity is more common in lower-income households. People who don’t eat enough nutritious food are more likely to suffer from health problems, which can also cause sleep issues.
Food insecurity is a significant source of stress. The anxiety, hunger, and economic uncertainty associated with lack of food or inadequate nutrition can contribute to poor sleep and insomnia. Sleep difficulties can also make work or school more challenging and cause further economic hardship.
Number of unemployed residents
Like food insecurity, unemployment can contribute to chronic sleep issues. Unemployment can also lead to hypersomnia, or excessive sleep and sleepiness. Longer-term unemployment may trigger depression, which is strongly associated with sleep difficulties, especially insomnia. Unemployment can go hand in hand with other issues that have a negative effect on sleep, including inconsistent income, poor living conditions, depression and/or anxiety, and substance abuse.
A recent study shows that people with sleep apnea are more likely to have a history of job loss and unemployment. (8) Sleep disorders can result from job loss and contribute to it, as well. This may be because sleep apnea, insomnia, and other sleep difficulties can cause illness, diminished brain function, irritability, and other physical and emotional effects that make keeping a job more difficult.
Median income
In our search for the best cities for sleep, we included data on median income. Studies show that more sleep may equal more income, particularly over time. (9) Sleep improves productivity, which can directly correlate to a higher salary. Better work performance is linked to adequate sleep, while poorer performance, including on-the-job accidents and mistakes, is tied to poor sleep.
Workers tend to make more money in cities where the residents get more sleep. Just one extra hour of sleep each week could lead to 5% more earnings over the long-term. People who live in cities where it gets darker earlier generally sleep more and make a higher salary than people who live in areas where the sun goes down later. This is probably related to the body’s circadian rhythm, which is designed to respond to light cues and cause sleepiness once night falls.
Insufficient sleep
Perhaps the most crucial metric we looked at is insufficient sleep. Most adults need between seven and nine hours of sleep each night, but more than a third of US adults get less than that. Insufficient sleep can be caused by a number of reasons, including mood disorders, stress, sleep apnea, negative psychological associations with the bed and sleep, medications, and chronic pain. Lack of sleep accounts for about $400 billion in lost productivity each year.
Insufficient sleep is linked to serious and potentially irreversible health effects. Possible consequences of short-term sleep loss include fatigue, trouble concentrating, irritability, and a higher risk of illness. Sleep deprivation over the long term can lead to obesity, diabetes, heart disease, and dementia. Insufficient sleep also increases the risk of microsleep episodes, which can lead to car accidents and workplace injuries. (10)
Cities where residents sleep fewer than the recommended number of hours may have a greater risk of certain medical conditions and unhealthy behaviors. People in the Appalachias get the least amount of sleep and also report higher rates of obesity, physical inactivity, and smoking.
References
- Beccuti G, Pannain S., Sleep and Obesity, Current Opinion in Clinical Nutrition and Metabolic Care, July 14, 2011
- Krahn LE., Psychiatric disorders associated with disturbed sleep, Seminars in Neurology, March 25, 2005
- Stein MD, Friedmann PD., Disturbed Sleep and Its Relationship to Alcohol Use, Substance Abuse, November 10, 2009
- Chang JJ, Pien GW, Stamatakis KA, Brownson RC., Association between physical activity and insomnia symptoms in rural communities of southeastern Missouri, Tennessee, and Arkansas, Journal of Rural Health, June 29, 2013
- Jaehne A, Unbehaun T, Feige B, Lutz UC, Batra A, Riemann D., How smoking affects sleep: a polysomnographical analysis, Sleep Medicine, December 13, 2012
- Billings ME, et al., The Association of Ambient Air Pollution with Sleep Apnea: The Multi-Ethnic Study of Atherosclerosis, Annals of the American Thoracic Society, March 16, 2019
- Meng Ding, Food Insecurity Is Associated with Poor Sleep Outcomes among US Adults, The Journal of Nutrition, March 2015
- Jose R. Bautista, et al., Individuals with Obstructive Sleep Apnea have Higher Likelihood of Multiple Involuntary, Job Losses, Sleep, April 2019
- Mattew Gibson, Time Use and Labor Productivity: The Returns to Sleep, The Review of Economics and Statistics, December 2018
- Williamson AM, Feyer AM., Moderate sleep deprivation produces impairments in cognitive and motor performance equivalent to legally prescribed levels of alcohol intoxication, Occupational and Environmental Medicine, October 2000